Stock Market Analysis
Stocks have continued their rally off the December lows and have reached a point that they were previously rejected four times. More specifically, the S&P 500 is currently fighting the 2800 level once again. It failed six times previously over the last year. Could this be lucky number seven?
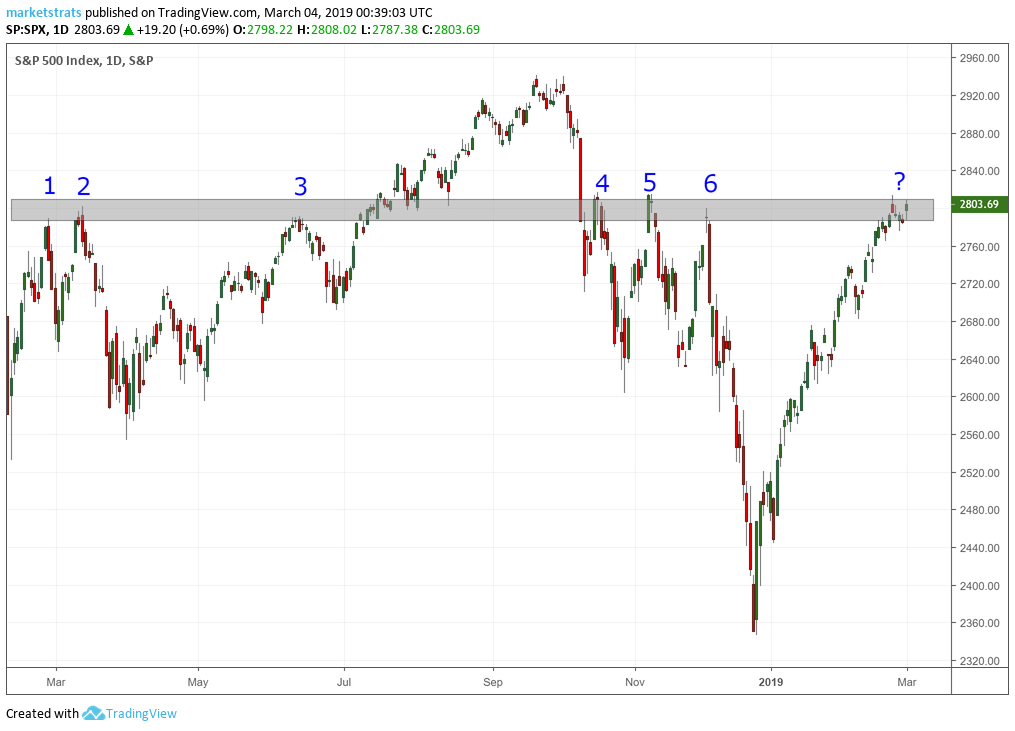
Market internals seem to think so, and so does our tactical model (a sleeve of the overall portfolio). Our target allocations have quickly returned in line after a monster start to the year and as of today, the model is fully back in line once again.
Looking ahead, one key leading indicator that we have mentioned in this newsletter before is the NYSE Advance Decline Line, which is a measure of market breadth. As you see below, it just made an all-time high a week ago.
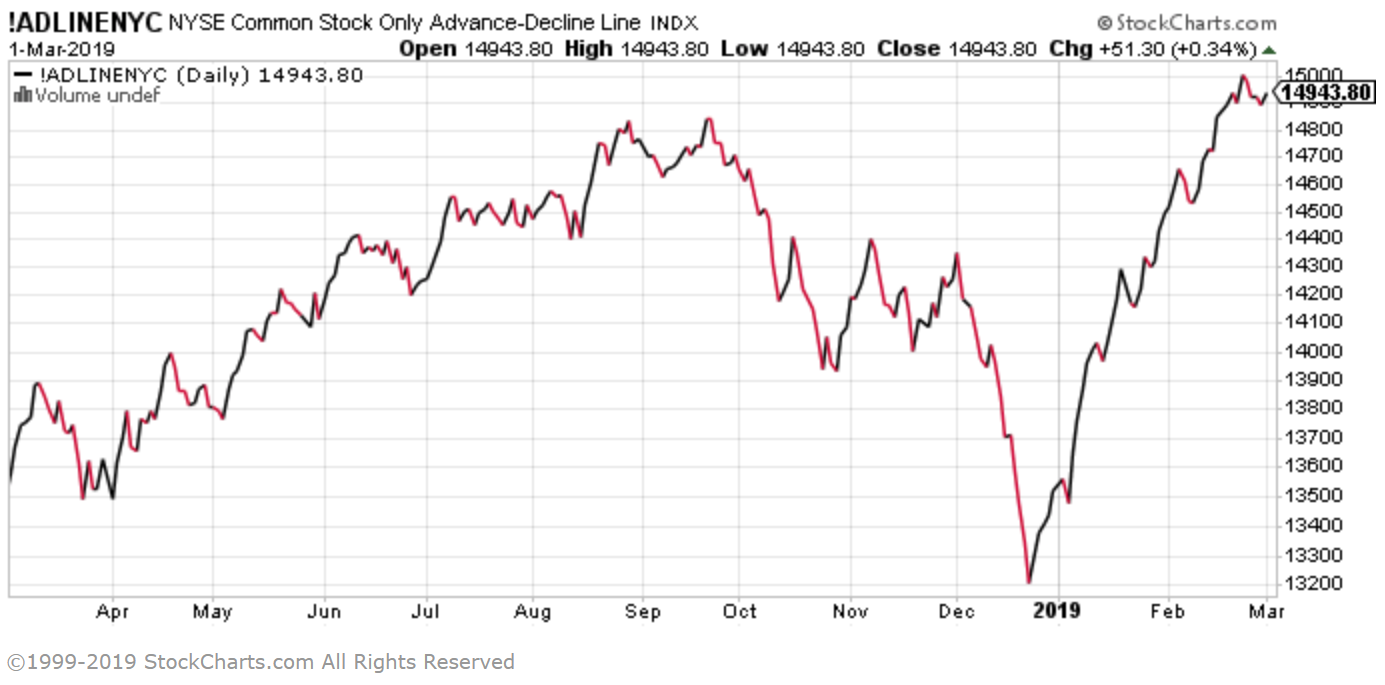
This means more stocks are participating in the good times, and while nothing is ever a given, it should theoretically improve this rally’s strength.
So, how much do we have to look forward to? Even after the rally, quite a bit. There’s certainly room to the upside—especially around the globe. As of the end of February, International Developed stocks (VEA) were still 17.38% below their 2018 high, Emerging Market stocks (VWO) 22.51%, and US stocks (VTI) 5.84%.
Moreover, since 1928, positive US stock months in both January and February like we just experienced has led to a positive year 87% of the time with an average total return of 16.8% (data from Equity & Quant Strategy team at Merrill Lynch).
Interest Rates, Real Estate, & Dividends
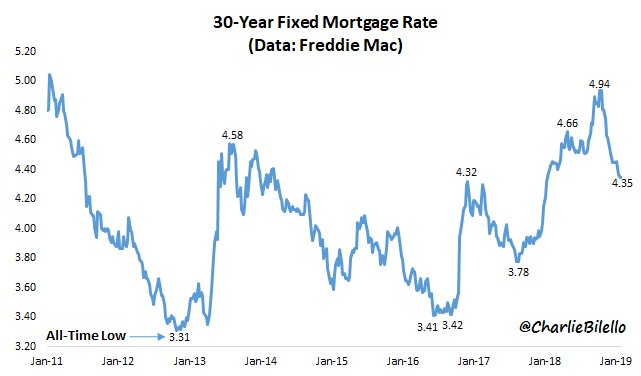
On the bond front, we have seen a positive start to the year too. Investors’ previous fear of rapid rate increases has faded with continued news that the Federal Reserve seems to be content with current levels for now. The latest chatter is that the Fed rate will be on hold until at least May.
In turn, we have seen a direct correlation between reduced mortgage rates and increased new home permits, which had previously slowed.
This post is an excerpt from a private client newsletter on 3/4/2019.