Benjamin Franklin was not talking about our investment portfolios, but he might as well have been.
Many investors know that the US stock market has averaged an approximate 7% return per year since its inception. Compounding that figure—or any positive one really—over a number of years will look great in a spreadsheet projection. The logic is that in X amount of years, you will be sitting pretty and have that much more money.
In actuality, returns will deviate from that expected return. In fact, they will vary greatly. I would say that they will stray from the norm, but the truth of the matter is that there is no real norm. Every forward-looking decade, year, month, week, day, hour, minute, second, and tick of the market is a complete unknown. I analyzed some data using Portfolio Visualizer for VFINX, a Vanguard mutual fund that tracks the S&P 500 Index. As you will see on the annual returns chart below, there is no distinguishable pattern.
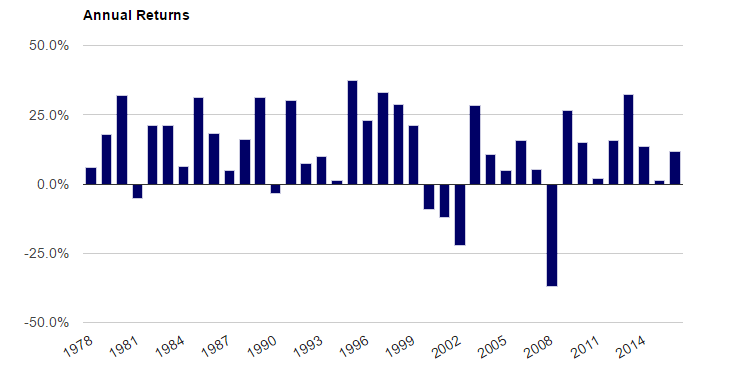
Dividends and distributions reinvested. Taxes and transaction fees not included.
Lumpy returns aside, it is still not their unevenness that throw market participants off track. Random returns are tolerable. It is the scary drawdowns that do the trick. When volatility rears its ugly head, many investors run for the sidelines—often at the worst possible time.
Although it might not seem like it lately, these dips in the market happen frequently. When you login to your accounts or check your statements, you understandably want to see a higher balance than you’ve ever seen before. It just doesn’t always work out that way. In a 2015 study, Marotta on Money calculated that in 6.96% of market days the S&P 500 hits an all-time high, which is about 25 days a year. This leaves your investments in a drawdown state roughly 97% of the time, as the graph below demonstrates.
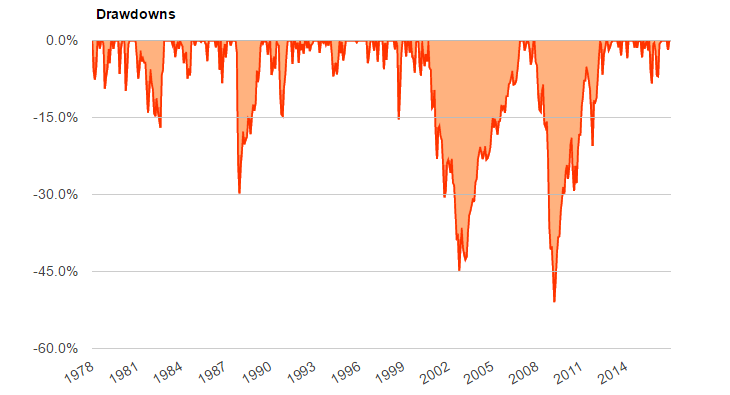
Drawdowns are calculated based on monthly returns.
By the same token, it is only human nature to judge your portfolio against its high-water mark. And when you lose money, it hurts. Even the most fortunate people—ones with no need to draw income off of their portfolio—will need a strong stomach to stay invested through the inevitable rough patches.
So is there a better way? While it is important to know how much your investments are worth, I encourage my clients to take a different approach by attaching their portfolio to a financial plan with real-life goals, even if that goal is just letting it all ride until they pass the money down to their heirs. Intertwining real-life goals with your financial investments might sound even more complicated.
How do you do that?
Fortunately, there is some tremendous technology available to help. MarketStrats has chosen to partner with RightCapital, a next generation financial planning software firm. In their own words, here is what that allows us to do:
Retirement Planning
Monte Carlo simulation; social security optimization; systematic stress tests; switching between cash flow and goal based planning.
Budget and Debt Management
Engage Gen X/Y clients with their budgeting, cash flow and debt reduction needs.
Data Collection
Digitize the information collection process via collaboration with clients.
Tax-efficient Distribution
Illustrate optimal withdrawal strategies, combining the sequence of withdrawals from taxable, tax deferred and tax free accounts with Roth conversions.
Account Aggregation
Seamlessly retrieve and update account and holding information from various asset custodians and thousands of financial institutions.
Client Portal
Engage clients with a powerful client portal. Provide access to their financial plan with real-time updates.
These tools allow for a comprehensive plan that is actually easy to understand and to implement. I believe this should all happen before even a single investment is selected. Let your plan drive the decision making process and take a top down approach for what to invest in. If you complement one of these financial plans with a rules-based investment strategy, then you’re really cooking.