Everyone has heard of beauty pageants. Contestants are judged on their looks, hidden talents, and character. In the world of investing, there is a different kind of beauty pageant. Portfolio managers, investors, and indexes are pinned against one another to see who can generate the highest return.
An investment beauty pageant is a dangerous thing. Don’t get me wrong—high returns in a vacuum are great. That is how money is made, after all. However, if an investment advisor is pinned against another in a return competition to win new client business, watch out.
The money manager is then incentivized to shoot for the moon—portfolio risk be damned. And if things start to go sour, they have to stick their neck out even further just to get back to even. This is an important but often overlooked concept. The numbers don’t lie:
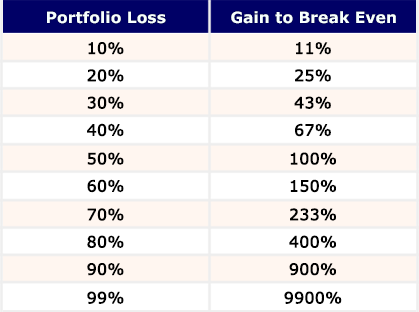
Of course the same is true of an index fund that you are holding, but it’s passive and doesn’t have a mind of its own. There is no hidden agenda, and it’s not trying to dig out of a hole by taking on more risk.
With that said, I am pretty sure that I have criticized active management enough for now. So, please let me begin to turn the page. There is a way; a happy medium. There are never any guarantees in investing, but active management can certainly work.
At MarketStrats, we use asset allocation models with both a strategic and tactical sleeve. The strategic portion is passive/passive and the tactical portion is active/passive. As seen in the image below, this means our underlying investments are low-cost passive index funds in both instances.
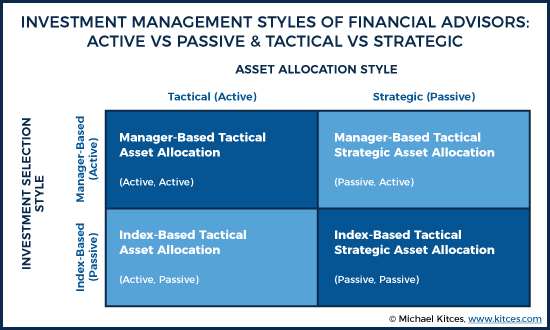
Source: Kitces.com
The collective management of these index funds is what differs.
In the strategic sleeve, there is a target allocation to each asset class. This is comparable to a “buy and hold” strategy. An example would be targeting 60% stocks and 40% bonds. Once a year, the portfolio is rebalanced back to those original targets. This is passive/passive.
The other sleeve of the portfolio is a tactical one that has those same index funds but they are eligible to have a shift in their target weighting when a specific investment criteria is hit. This is a form of market timing, which is a dirty phrase to some and a livelihood to others. This is active/passive.
So, how do we manage the active portion? That is the big question. Here’s a sneak peek.
We rely on research done on a concept called trend following. The premise behind trend following is called inertia and can be explained by Newton’s First Law: an object at rest stays at rest and an object in motion stays in motion with the same speed and in the same direction unless acted upon by an unbalanced force.
With investments, there are a number of technical indicators that can be used to evaluate a trend. The most common is called a simple moving average. It is calculated by adding the closing price of a stock for a number of time periods and then dividing this total by the number of time periods. For example, a 200-day moving average takes the average closing stock price over those last 200 days. These averages can be graphed onto charts to compare a stock’s current price (black line) to its moving average (blue line) like below:
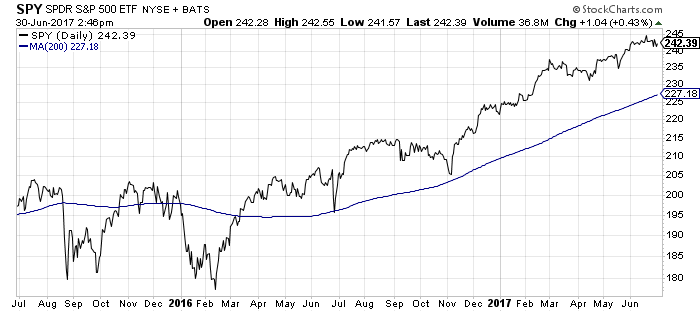
Source: StockCharts.com
One easy to follow strategy is to buy when price is above a moving average and sell when price is below. Last year, Seeking Alpha researched how different moving average time interval strategies have fared vs the S&P 500 Index since 1951. Their findings are in the chart below. Please note that standard deviation is a measure of volatility (lower is better) and Sharpe Ratio is a measure of return with respect to the risk taken (higher is better).
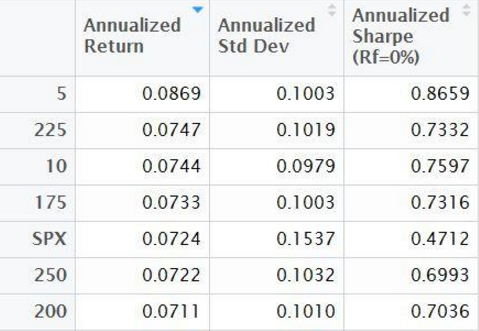
Source: SeekingAlpha.com
This is how they summarize their findings:
- The 200-day moving average strategy has increased risk-adjusted returns since 1951, but underperforms the S&P 500 on a price return basis.
- In this article, I show that the 225-day moving average strategy has several advantages and outperforms the S&P 500.
- Short-term moving average strategies have yielded spectacular returns from 1951-2000, but have shown tremendous weakness since 2001.
While there is certainly no holy grail to investing, trend following on certain intervals has historically produced higher risk-adjusted returns. Returns themselves have varied, and it’s impossible to know which strategy will ultimately yield the best over a given time period.
Regardless, the goal of trend following is to get in for the best of times and get out for the worst of them. You will likely be faked out and miss some moves, but the goal isn’t to catch every price fluctuation in the market. It is to be invested (or not) for the bulk of a trend.
We use this type of data as evidence and roll it into a rules-based strategy, which we consider to be non-predictive analysis. We let inertia take its course, and by doing so, we take the elements of emotion and competition out of the picture. Coupled with using the most telling metrics, such as risk-adjusted returns, we take the beauty pageant out of investing.
For further reading on evidence-based investing, I recommend this interview with Josh Brown of Ritholtz Wealth Management.