While we continue to see all-time highs across the globe in stocks, there seems to be a news media outlet calling the top everyday. This speculation is mostly interesting to discuss and certainly drives ratings. But ultimately, no one really knows. It’s really, really hard to call the top of a market. Eventually, someone will be right by default.
For now, let’s all enjoy our rising investment values and portfolio growth. For Pete’s sake, the Dow Jones Industrial Average just saw its first 8-quarter win streak in 20 years! We are still in the midst of a major bull market.
Unfortunately, the consistent compounding gains won’t continue forever. They can’t. That is why a market is a market. Assets fluctuate in value, and losses are necessary from time-to-time. If investors never sold, there would be no true way to price things.
In the spirit of this perspective, it’s our job to make sure we have a plan in place for when the tide does inevitably turn. This is the best time to plan—when things are going well.
When we do start to see the market selling off, do we hold on tight and ride the waves? Do we sell? Sell partially? Buy more? How much of a drop is actually considered a sell off?
Whatever the strategy, just have one and stick to it. Otherwise, your trades could just depend on what kind of day you are having—not exactly the best way to deal with your life savings.
Building off of our previous trend following blog post, MarketStrats has a blend of strategic and tactical models. Our strategic model is built to periodically rebalance back to its target allocations, and our tactical model will trigger trades when the long-term uptrend dissipates in a particular asset class.
In other words, we have rules-based models in place to sell a piece of client holdings when the trend shifts downward. The goal is to prevent even larger losses with the understanding that it could be a fake-out back to the upside. However, it’s a bet that we are willing to take to control our risk.
Of course, hindsight is 20/20 but there are often warning signs. Let’s evaluate the two most notorious market crashes in recent memory.
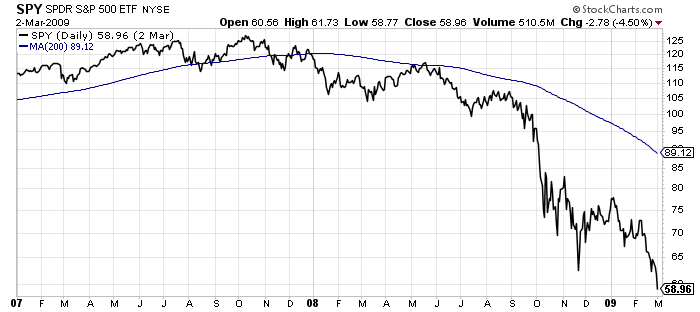
The chart below is of the S&P 500 during the financial crisis. Price is in black. Now, look at the blue line. It represents the average closing price of the prior 200 days. See how the slope changes in early 2008 and then begins to point downward. The simple moving average is considered a lagging indicator but watch how price moves right along with it in this case:
Okay, perhaps just one lucky timing call. How about the tech bubble bursting in 2000? See below for a NASDAQ chart:
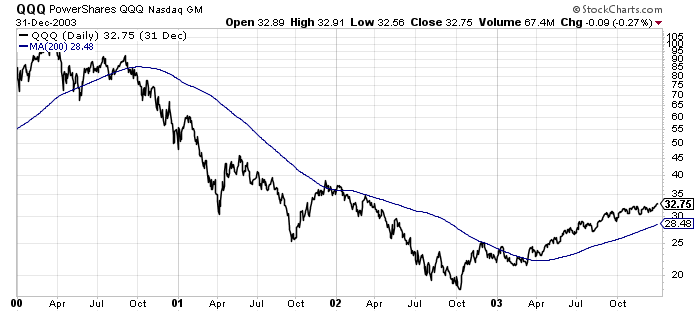
For the most part, it works again in late 2000. This one also showed the recovery in 2003 quite nicely as the slope moves back into positive territory and price breaks out above the moving average.
If you look closely, expand the time range evaluated, or flat out change the time range completely, you will get some “fake-outs” too. There is no sure thing or perfect timing model. A trend-following strategy also won’t avoid “flash crashes” or short-term volatility. However, it serves as a piece of the plan. Moving averages can stand on their own or be coupled with another indicator to formulate a solid trend following strategy.
MarketStrats has strategies in place. We are ready for the next move, whenever that time may come.