What is the reason that the stock market just dropped 10% off its January high and officially entered into “correction” territory?
If only it were that easy. There is hardly ever just one answer. I will do my best to tackle that question, but first, some facts:
- On average, the stock market has a correction every 357 days.
- Our last correction was roughly two years ago making us overdue.
- Stocks had gone up so much (and so fast) that despite this current dip, the Dow Jones Industrial Average remains above an upward sloping 200 day moving average.
- This is a common indicator used to identify a long-term trend.
- Good economic or political news does not automatically equate to stock market gains, nor does bad news equate to a decline.
If you are more of a visual person, this chart in the New York Times says a lot.
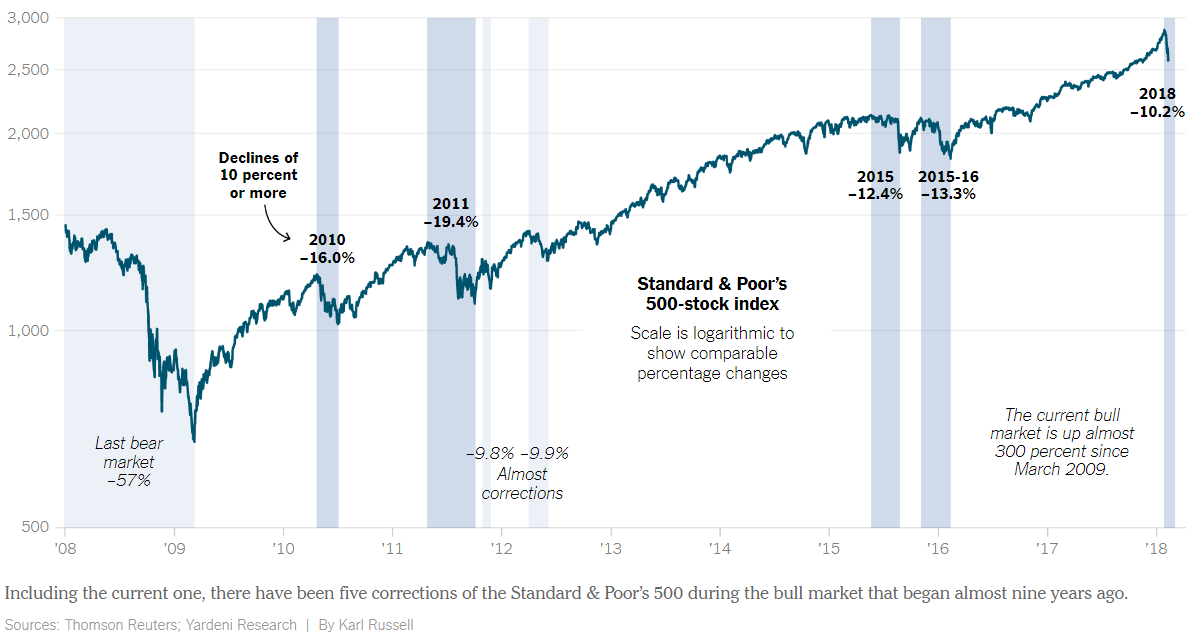
Source: The New York Times
Okay, enough of that. Why does all of this happen? What drives the price of the markets? Ultimately, it comes down to supply and demand by way of valuation and sentiment. And all of them have been changing. Here’s how.
Inflation has started to rear its ugly head with contributions across the board. The US dollar has been weakening, wages are up in the labor market, and tax cuts are on the horizon. Economic growth forecasts have kicked into high gear.
In turn, to keep the economy from overheating, we have seen interest rates continue to increase. This adds a long-lost wrinkle to the equation. Now, investors can earn at least some interest in a money market account and newly issued bonds are generating higher yields.
“So what?” Well, asset classes are always in competition against one another. Bonds versus stocks. Real estate versus CDs. On and on. They are all fighting for investor dollars and with less risky ways now becoming available to generate a decent return, there is some pressure on stocks.
Have valuations changed that much to justify a 10% drop? Maybe, but it really doesn’t matter. This is where sentiment comes in. Market psychology is not an exact science. However, the CNN Money Fear & Greed Index just registered the most fearful reading since 2015. Nothing is ever for certain but usually, extreme readings provide inflection points in market behavior. Investors use indicators like this to bet on a change back in the opposite direction.
Again, we don’t know for sure. The past week or so has been tough but the facts say that periods like this are normal and oftentimes even healthy. Regardless, to obtain market returns, we must pay our dues and endure some market volatility. So, here we are. Time to earn it.